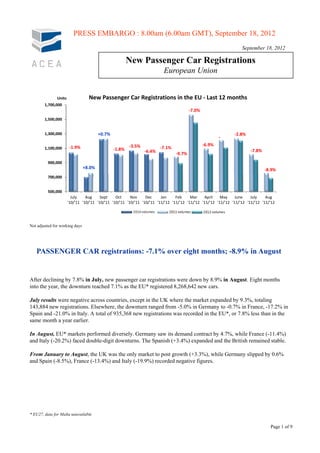
- New passenger car registrations in the EU were down 8.9% in August compared to the same month last year. This follows a 7.8% decline in July.
- Over the first eight months of the year, registrations across the EU declined 7.1% compared to the same period in 2011.
- Of the major markets, Germany saw a 4.7% decline in August, while France and Italy saw double-digit drops of 11.4% and 20.2% respectively over the same month.
1) New passenger car registrations in the EU were down 8.9% in August and 7.1% over the first eight months of the year compared to the same periods in 2011.
2) In August, markets performed diversely, with Germany down 4.7%, France down 11.4%, and Italy down 20.2%, while Spain saw growth of 3.4% and the UK was stable.
3) From January to August, only the UK saw growth at 3.3%, while Germany declined 0.6% and Spain, France, and Italy all saw negative figures between -8.5% and -19.9%.
Dati statistici mercato auto europa settembre 2012Autoblog.it
- New passenger car registrations in the EU declined for the twelfth consecutive month in September, falling 10.8% compared to September 2011.
- From January to September, new car registrations decreased 7.6% compared to the same period in 2011.
- Major markets like Germany, France, Italy and Spain all saw double-digit declines in September, while only the UK expanded.
Immatricolazioni auto europa giugno 2012Autoblog.it
- New passenger car registrations in the EU declined by 2.8% in June compared to June 2011, continuing a downward trend since October 2011.
- For the first half of 2012, demand was down 6.8% compared to the first six months of 2011.
- Results varied by country, with Germany and the UK seeing growth while Spain and Italy contracted sharply.
- New passenger car registrations in the EU declined sharply by 16.3% in December 2012, continuing a downward trend over the past 15 months.
- Over the full year 2012, new car demand reached its lowest level since 1995, with an 8.2% contraction.
- Most major EU markets recorded double-digit declines in December registrations, ranging from -14.6% in France to -23% in Spain. Only the UK saw growth at 3.7%.
- New passenger car registrations in the EU were down 8.7% in May 2012 compared to May 2011, the eighth consecutive monthly decline. For the first five months of 2012, registrations were down 7.7% compared to the same period in 2011.
- Most major EU markets saw contractions in May registrations, ranging from 4.8% in Germany to 16.2% in France. Only the UK saw growth at 7.9%. From January to May, Germany was stable at +0.3% while the UK grew 2.6%, but other major markets declined, led by France at -17.2% and Italy at -18.9%.
- Among automakers, the V
- New passenger car registrations in the EU declined 10.5% in February compared to the same month last year, reaching the lowest level in over a decade at under 800,000 units.
- Over the first two months of the year, demand dropped 9.5% compared to 2012.
- Germany, Spain, France, and Italy all saw double-digit declines in February, while the UK was the only major market to post growth.
- New passenger car registrations in the EU declined 10.2% in March compared to March 2012, marking the 18th consecutive monthly decrease. For the first quarter of 2013, registrations were down 9.8% year-over-year.
- Among major EU markets, the UK saw growth of 5.9% while Italy, Spain, France and Germany all saw double-digit declines ranging from 4.9% to 17.1%.
- For the top manufacturers, the VW Group saw a 9% decline in March, while PSA Group was down 16% and Renault fell 9.6% compared to the previous year.
The document compares median home prices and housing inventory in June 2009 to June 2010 in Frisco, Texas. It finds that the median price of for-sale homes was unchanged, while the median price of homes sold increased by 9%. The number of for-sale homes decreased by 7% and the number of homes sold decreased by 13%. The average months of inventory increased by 52% from June 2009 to June 2010.
The median price of for sale properties increased 3% from June 2009 to June 2010, while the median price of sold properties rose 12%. The number of for sale properties decreased 1% while the number of sold properties remained the same. Additionally, the average months supply of inventory was up 52% from June 2009 to June 2010.
The document compares housing market data from July 2009 to July 2010 in Plano, Texas. It finds that the median price of homes for sale decreased 6% while the median price of homes sold increased 5%. Additionally, the number of homes for sale increased 11% while the number of homes sold decreased 36%. The average months supply of inventory, a measure of housing market balance, increased 85% from July 2009 to July 2010.
The document compares housing market data from July 2009 to July 2010 in Addison, Texas. It finds that the median price of for-sale properties increased 5% while the median price of sold properties decreased 20%. Additionally, the number of for-sale properties rose 24% while the number of sold properties declined 67%. Finally, the average months supply of inventory, a measure of housing demand and supply balance, was down 12% in July 2010 compared to the previous year.
Carrollton TX - Housing Market Report - August 2010Valarie Littles
The document compares housing market data from August 2009 to August 2010 in Carrollton, Texas. It finds that the median price of homes for sale increased 3% while the median price of homes sold increased 5%. The number of homes for sale grew 16% from August 2009 to August 2010 while the number of homes sold declined 34% over the same period.
The document compares median home prices and housing inventory in June 2009 to June 2010 in Plano, Texas. It finds that the median price of for-sale homes was unchanged, while the median price of homes sold increased 11%. The number of for-sale homes rose 7% but the number of homes sold fell 19%. Finally, the average months of inventory increased 67%, indicating a shift to a buyers' market.
The document summarizes real estate data from June 2009 to June 2010 in McKinney, Texas. It states that the median price of for-sale properties decreased 7% while the median price of sold properties increased 5%. Additionally, the number of for-sale properties decreased 5% and the number of sold properties decreased 31%. Finally, the average months of inventory increased 75% from 4.3 months to 7.5 months.
Rockwall TX - Housing Market Report - August 2010Valarie Littles
The document compares housing market data from August 2009 to August 2010 in Rockwall, Texas. It finds that the median price of for-sale properties decreased 1% while the median price of sold properties decreased 4%. The number of for-sale properties increased 6% while the number of properties sold decreased 28%. Additionally, the average months of inventory increased 52% from August 2009 to August 2010.
Rockwall TX - January 2011 - Housing Market ReportValarie Littles
The document compares housing market data from January 2010 to January 2011 in Rockwall, Texas. It finds that the median price of homes for sale decreased 9% from $219,500 to $200,000 over this period, while the median price of homes sold decreased 6% from $180,250 to $170,000. The number of homes for sale increased 7% from 417 to 447 properties, while the number of homes sold decreased 13% from 30 to 26 properties over the same period.
The document compares housing market data from May 2009 to May 2010 in Allen, Texas. It finds that the median price of for-sale properties increased 1% while the median price of sold properties decreased 4%. The number of for-sale properties decreased 7% and the number of sold properties increased 37%. Additionally, the average months of inventory increased 64% from 3.7 to 6.1 months.
Allen TX - November 2010 - Housing Market ReportValarie Littles
The document compares real estate data from November 2009 to November 2010 in Allen, Texas. It finds that the median price of for-sale properties decreased 8% while the median price of sold properties increased 12%. Additionally, the number of for-sale properties increased 28% while the number of sold properties decreased 23%. Finally, the average months supply of inventory, a measure of housing demand and supply, declined 15%.
Frisco TX - January 2011 - Housing Market ReportValarie Littles
The document compares housing market data from January 2010 to January 2011 in Frisco, Texas. It shows that the median price of homes for sale increased 3% while the median price of homes sold decreased 6%. The number of homes for sale decreased 1% and the number of homes sold increased 9%. The average months of inventory, or time it would take to sell all homes listed, decreased 4%.
Plano TX - January 2011 - Housing Market ReportValarie Littles
The median price of for-sale properties in January 2011 was down 7% from January 2010, while the median price of sold properties was up 6%. The number of for-sale properties increased 11% from January 2010 to January 2011, and the number of sold properties was up 17%. Additionally, the average months supply of inventory was up 27% in January 2011 compared to January 2010.
The document compares median home prices and housing inventory in April 2009 to April 2010 in Frisco, Texas. It finds that the median price of for-sale homes decreased 2% from $300,000 to $295,000 while the median price of sold homes decreased 7% from $241,500 to $225,000 over this period. The number of for-sale homes decreased 1% from 1,486 to 1,475 homes, while the number of homes sold decreased slightly from 202 to 201. The average months of inventory decreased 19% from 5.5 to 4.5 months.
Carrollton TX - January 2011 - Housing Market ReportValarie Littles
The document compares real estate data from January 2010 to January 2011 in Carrollton, Texas. It shows that the median price of for-sale properties and sold properties decreased 5% in both cases. The number of for-sale properties increased 23% while the number of sold properties rose only 2%. Additionally, the average months of inventory increased 23% from January 2010 to January 2011.
Rafael Matesanz - Spain - Monday 28 - Strategies to increase the number of c...incucai_isodp
The document discusses strategies for increasing deceased organ donation rates around the world. It provides an overview of organ donation rates in different countries and regions, factors that influence donation effectiveness like healthcare structure and population willingness. Benchmarking studies identified best practices for donor detection, management, and obtaining consent from top performing hospitals. Recommendations were developed and guidelines published in multiple languages to spread these practices and help other areas progress toward self-sufficiency in organ transplantation.
The document compares housing market data from June 2009 to June 2010 in Murphy, Texas. It states that the median price of for-sale properties decreased 5% while the median price of sold properties increased 4%. The number of for-sale properties decreased 13% and the number of sold properties increased 19%. Additionally, the average months of inventory increased 39% from 3.5 to 4.8 months.
The document summarizes real estate data from May 2009 to May 2010 in Savannah, Georgia. It shows that during this period:
- The median price of for-sale properties decreased 5% (from $162,445 to $155,000) while the median price of sold properties decreased 8% (from $139,900 to $129,000).
- The number of for-sale properties increased 26% (from 54 to 68 properties) while the number of sold properties increased 71% (from 7 to 12 properties).
- The average months of inventory increased 418% (from 3.8 months to 19.7 months).
The document provides real estate data for Austin, Texas from December 2008 to December 2010. It shows that over this period:
- The median sold price of homes increased 19% from $252,500 to $300,000.
- The median price of homes for sale decreased 13% from $425,000 to $370,000 while the median price of homes sold increased 19%.
- The number of homes sold increased 375% from 4 homes in December 2008 to 19 homes in December 2010.
- The number of homes under contract increased 260% from 5 homes in December 2008 to 18 homes in December 2010.
The document compares real estate data from March 2010 to March 2011 in Rockwall, Texas. It finds that the median price of for-sale properties decreased 4% while the median price of sold properties decreased 13%. Additionally, the number of for-sale properties decreased 5% and the number of sold properties decreased 41%. The average months of inventory increased 12% from March 2010 to March 2011.
Rockwall TX - Housing Market Report - November 2010Valarie Littles
The document compares real estate data from November 2009 to November 2010 in Rockwall, Texas. It finds that the median price of for-sale properties decreased 11% while the median price of sold properties decreased 7%. Additionally, the number of for-sale properties increased 18% while the number of properties sold decreased 55%. The average months of inventory increased 32% from November 2009 to November 2010.
The document provides market data on housing inventory levels in Philadelphia over a two year period from August 2007 to August 2009. It shows that during this time period:
- The months supply of inventory (MSI) decreased from 9.2 to 8.2, a 10.3% decline.
- The average days on market (DOM) increased from 62 to 77, a 24.1% rise.
The document summarizes housing market dynamics in Philadelphia over a 2-year period from July 2007 to July 2009. It shows that the months supply of inventory decreased slightly from 8.1 to 8.0 over this period, representing a 1.8% change. The average days on market increased from 63 to 72, a 15.4% rise. The data is presented monthly and includes statistics like properties for sale, under contract, sold, and the national months supply of inventory for comparison.
1 1 09 Median Price Listed, Under Contract, And Soldtjovanovski
This document analyzes median home prices in the Phoenix, Arizona region from December 2006 to December 2008. It shows that during this period, the median prices for homes that were for sale, under contract, and sold all declined significantly, with a 37.4% drop in the median price for homes for sale. The number of newly listed homes also declined over this period as the housing market contracted.
The document summarizes housing market dynamics in Philadelphia over a two-year period from October 2007 to October 2009. It shows that the months supply of inventory decreased from 9 to 7 over this period, a 21.2% decline. The average days on market increased slightly from 64 to 73. The number of properties for sale and under contract fluctuated monthly but generally declined from their peak in late 2007 and early 2008.
Between December 2006 and December 2008:
- The number of for-sale residential units in the MLS increased from 57,505 to 69,472, a rise of 11,967 units or 20.8%.
- The average days on market for sold units was 77 days in December 2008.
- Over 11,000 new listings were added in December 2008.
This document analyzes economic trends in India from 2006-2012 using data on treasury bill yields, wholesale price index (WPI), nominal interest rates, and inflation rates. It shows that treasury bill yields and WPI generally increased together from 2006-2008 and 2010-2012. It also finds a moderate positive correlation between nominal interest rates and inflation rates over this period. The analysis suggests that changes in treasury bill yields by the central bank are used as a monetary policy tool to control inflation.
1 1 09 Percentage Of Homes Under Contracttjovanovski
The document analyzes market dynamics in the Phoenix, Arizona real estate market from December 2006 to December 2008 by looking at the number of properties for sale, under contract, and the percentage under contract each month. It shows that from December 2006 to December 2008, the number of properties for sale increased by 20.8% (from 57,505 to 69,472) while the number under contract increased by 31.5% (from 4,391 to 5,773). The percentage of properties under contract each month fluctuated between 4.1% to 10.7% with no clear upward or downward trend over the two-year period.
The document analyzes housing market dynamics in Philadelphia over a two year period from March 2008 to March 2010. It shows that the months supply of housing inventory decreased from 8 months in March 2008 to 6 months in March 2010, a 27.1% decline. The months supply of inventory is a measure calculated by dividing current listings by the monthly sales rate. The data indicates that between 2008-2010, the Philadelphia housing market transitioned from a buyer's market to a seller's market as the supply of homes decreased relative to monthly demand.
The document analyzes housing market dynamics in Philadelphia over a two year period from March 2008 to March 2010. It shows that the months supply of housing inventory decreased from 8 months in March 2008 to 6 months in March 2010, a 27.1% decline. The months supply of inventory is a measure calculated by dividing current listings by the monthly sales rate. The data reflects a softening real estate market with reduced housing supply over the period analyzed.
The document provides market dynamics data for a 2-year period from September 2007 to September 2009. It shows that the months supply of inventory increased slightly from 10.7 to 10.9 over this period, a 1.9% rise. The average days on market also increased from 73 to 79, a 7.6% increase. The document includes a table with monthly figures on months supply of inventory, properties for sale and under contract, average days on market, and properties sold.
This document analyzes the housing market inventory and sales in the Philadelphia area over a two year period from May 2008 to May 2010. It shows that the months supply of inventory under the usual calculation decreased by 3 months and the percentage decreased by 22.1% over this period. The number of homes listed for sale fluctuated between around 8,500 to 10,500 over the months while the number of homes sold ranged from around 600 to 1,400 per month.
The document analyzes the months supply of housing inventory in Philadelphia over a two year period from April 2008 to April 2010. It shows that the months supply of inventory decreased from 8 months in April 2008 to 5 months in April 2010, a 42.2% decrease. The months supply of inventory fluctuated during this period but had an overall downward trend, indicating housing demand was outstripping supply.
The document analyzes the months supply of housing inventory in Chester County over a 2 year period from June 2008 to June 2010. It shows that the months supply of inventory under the usual calculation (MSI-UC) decreased from 12 months to 11 months over this period, a total decrease of 18.78%. The number of homes for sale last day of the month fluctuated between around 3,500-4,100, while homes under contract and homes sold per month also varied considerably over the periods shown.
The document analyzes the months supply of housing inventory over a 2 year period from June 2008 to June 2010 for Chester County. It shows that the months supply of inventory under the usual calculation (MSI-UC) decreased from 12.8 in May 2010 to 11 in June 2010, representing a total decrease of 2.2 units or 18.78% over the full period. The data includes numbers of homes for sale, under contract, and sold each month to calculate the MSI-UC.
The document analyzes the months supply of housing inventory in Chester County over a 2 year period from June 2008 to June 2010. It shows that the months supply of inventory under the usual calculation (MSI-UC) decreased from 12 months to 11 months over this period, a total decrease of 18.78%. The number of homes for sale fluctuated between around 3,500 to 4,200 over the months while the number of homes sold each month varied significantly from 197 homes in February 2010 to 695 homes in June 2010.
Sarasota Market Statistics - June 2010
To view homes for sale in Sarasota:
http://www.searchforsarasotaproperties.com
To learn more about Sarasota Real Estate:
http://www.sarasotarealestatetalk.com
The document provides an economic review of the Reno-Sparks metropolitan statistical area (MSA). It finds that while employment increased by 5,900 from 2010 to 2011 and 7,500 from 2011 to 2012, unemployment remains high at 12.2% in February 2012. The largest employment decreases from February 2011 to February 2012 occurred in local government, construction, retail, and state government. The largest increases were in leisure and hospitality and professional and business services. Manufacturing, construction, and retail remain among the largest industry sectors for employment in the region. Taxable sales declined sharply during the recession but have leveled off in recent quarters.
The document shows median home sale prices in Philadelphia over a two year period from July 2008 to July 2010. It finds that the median price for homes sold decreased from $157,500 in July 2008 to $130,000 in July 2010, a drop of 17.5%. Additionally, it provides data on the number of homes for sale, under contract, sold, expired, and new listings each month over this period.
The document analyzes housing market supply and demand trends over a 2-year period from August 2007 to August 2009 in Philadelphia. It shows that during this period, the number of homes for sale decreased by 17.5%, homes under contract decreased by 8%, and homes sold decreased by 26.6%. The data is presented monthly and includes statistics on average days on market and new property listings.
Providence Village TX - Housing Market Report - August 2010Valarie Littles
The document compares housing market data from August 2009 to August 2010 in Providence Village. It finds that the median price of for-sale properties increased 2% while the median price of sold properties decreased 2%. Additionally, the number of for-sale properties rose 37% while the number of sold properties fell 45%. Finally, the average months of inventory increased 125% from 4.0 to 9.0 months.
Similar to Mercato auto europa_luglio-ìagosto_2012 (20)
Mini cooper s_countryman_all4_spec_02_2017_enAutoblog.it
The document provides technical specifications for two MINI Countryman models - a Cooper S Countryman ALL4 with a manual transmission and a Cooper S Countryman ALL4 with an automatic transmission. Both have a 1,998cc four-cylinder engine producing 141kW of power. Key differences are the manual has a 6-speed transmission while the automatic has an 8-speed transmission. Fuel consumption is also slightly better for the automatic at between 6.6-6.4L/100km compared to 7.0-7.1L/100km for the manual. Both feature all-wheel drive and have a maximum payload of around 600kg.
Tesla, la Nhtsa scagiona il sistema Autopilot: il verbaleAutoblog.it
Nessuna responsabilità del sistema di guida semiautonoma Autopilot nell'incidente mortale che ha coinvolto il 45 enne Joshua Brown a bordo della sua Tesla Model S il 7 maggio nei pressi di Orlando.
Mercato Auto Europa, le vendite nel 2016 Autoblog.it
Nel 2016 il mercato auto del vecchio continente cresce del 6,5%, con l'Italia a +15,8% che tira la volata. Il Gruppo Volkswagen resta leader, per FCA +14,4%
This document provides the technical specifications for the All New Nissan Micra in 1.0 petrol and 0.9 turbo petrol engine variants. It includes dimensions, powertrain details, performance metrics, fuel economy and emissions data. The 1.0 petrol model has a 998cc 3-cylinder engine producing 54kW, while the 0.9 turbo petrol has an 898cc 3-cylinder turbocharged engine producing 66kW. Both are available with a 5-speed manual transmission. The document also lists the Micra's chassis details, safety and driver assistance features.
FCA US is disappointed that the EPA has chosen to issue a notice of violation with respect to the emissions control technology employed in the company’s 2014-16 model year light duty 3.0-liter diesel engines.
FCA US looks forward to the opportunity to meet with the EPA’s enforcement division and representatives of the new administration to demonstrate that FCA US’s emissions control strategies are properly justified and thus are not “defeat devices” under applicable regulations and to resolve this matter expeditiously.
The new BMW M4 GTS is a high-performance 2-seater coupe with a 3.0L twin-turbo inline 6-cylinder engine producing 500hp and 442lb-ft of torque. It has a 7-speed dual-clutch transmission and can accelerate from 0-100km/h in just 3.8 seconds with a top speed of 305km/h. Key features include carbon ceramic brakes, an adaptive M suspension, and aerodynamic enhancements to improve performance.
Have you ever been confused by the myriad of choices offered by AWS for hosting a website or an API?
Lambda, Elastic Beanstalk, Lightsail, Amplify, S3 (and more!) can each host websites + APIs. But which one should we choose?
Which one is cheapest? Which one is fastest? Which one will scale to meet our needs?
Join me in this session as we dive into each AWS hosting service to determine which one is best for your scenario and explain why!
Discover top-tier mobile app development services, offering innovative solutions for iOS and Android. Enhance your business with custom, user-friendly mobile applications.
Must Know Postgres Extension for DBA and Developer during MigrationMydbops
Mydbops Opensource Database Meetup 16
Topic: Must-Know PostgreSQL Extensions for Developers and DBAs During Migration
Speaker: Deepak Mahto, Founder of DataCloudGaze Consulting
Date & Time: 8th June | 10 AM - 1 PM IST
Venue: Bangalore International Centre, Bangalore
Abstract: Discover how PostgreSQL extensions can be your secret weapon! This talk explores how key extensions enhance database capabilities and streamline the migration process for users moving from other relational databases like Oracle.
Key Takeaways:
* Learn about crucial extensions like oracle_fdw, pgtt, and pg_audit that ease migration complexities.
* Gain valuable strategies for implementing these extensions in PostgreSQL to achieve license freedom.
* Discover how these key extensions can empower both developers and DBAs during the migration process.
* Don't miss this chance to gain practical knowledge from an industry expert and stay updated on the latest open-source database trends.
Mydbops Managed Services specializes in taking the pain out of database management while optimizing performance. Since 2015, we have been providing top-notch support and assistance for the top three open-source databases: MySQL, MongoDB, and PostgreSQL.
Our team offers a wide range of services, including assistance, support, consulting, 24/7 operations, and expertise in all relevant technologies. We help organizations improve their database's performance, scalability, efficiency, and availability.
Contact us: info@mydbops.com
Visit: https://www.mydbops.com/
Follow us on LinkedIn: https://in.linkedin.com/company/mydbops
For more details and updates, please follow up the below links.
Meetup Page : https://www.meetup.com/mydbops-databa...
Twitter: https://twitter.com/mydbopsofficial
Blogs: https://www.mydbops.com/blog/
Facebook(Meta): https://www.facebook.com/mydbops/
Introduction of Cybersecurity with OSS at Code Europe 2024Hiroshi SHIBATA
I develop the Ruby programming language, RubyGems, and Bundler, which are package managers for Ruby. Today, I will introduce how to enhance the security of your application using open-source software (OSS) examples from Ruby and RubyGems.
The first topic is CVE (Common Vulnerabilities and Exposures). I have published CVEs many times. But what exactly is a CVE? I'll provide a basic understanding of CVEs and explain how to detect and handle vulnerabilities in OSS.
Next, let's discuss package managers. Package managers play a critical role in the OSS ecosystem. I'll explain how to manage library dependencies in your application.
I'll share insights into how the Ruby and RubyGems core team works to keep our ecosystem safe. By the end of this talk, you'll have a better understanding of how to safeguard your code.
"$10 thousand per minute of downtime: architecture, queues, streaming and fin...Fwdays
Direct losses from downtime in 1 minute = $5-$10 thousand dollars. Reputation is priceless.
As part of the talk, we will consider the architectural strategies necessary for the development of highly loaded fintech solutions. We will focus on using queues and streaming to efficiently work and manage large amounts of data in real-time and to minimize latency.
We will focus special attention on the architectural patterns used in the design of the fintech system, microservices and event-driven architecture, which ensure scalability, fault tolerance, and consistency of the entire system.
LF Energy Webinar: Carbon Data Specifications: Mechanisms to Improve Data Acc...DanBrown980551
This LF Energy webinar took place June 20, 2024. It featured:
-Alex Thornton, LF Energy
-Hallie Cramer, Google
-Daniel Roesler, UtilityAPI
-Henry Richardson, WattTime
In response to the urgency and scale required to effectively address climate change, open source solutions offer significant potential for driving innovation and progress. Currently, there is a growing demand for standardization and interoperability in energy data and modeling. Open source standards and specifications within the energy sector can also alleviate challenges associated with data fragmentation, transparency, and accessibility. At the same time, it is crucial to consider privacy and security concerns throughout the development of open source platforms.
This webinar will delve into the motivations behind establishing LF Energy’s Carbon Data Specification Consortium. It will provide an overview of the draft specifications and the ongoing progress made by the respective working groups.
Three primary specifications will be discussed:
-Discovery and client registration, emphasizing transparent processes and secure and private access
-Customer data, centering around customer tariffs, bills, energy usage, and full consumption disclosure
-Power systems data, focusing on grid data, inclusive of transmission and distribution networks, generation, intergrid power flows, and market settlement data
The Microsoft 365 Migration Tutorial For Beginner.pptxoperationspcvita
This presentation will help you understand the power of Microsoft 365. However, we have mentioned every productivity app included in Office 365. Additionally, we have suggested the migration situation related to Office 365 and how we can help you.
You can also read: https://www.systoolsgroup.com/updates/office-365-tenant-to-tenant-migration-step-by-step-complete-guide/
Dandelion Hashtable: beyond billion requests per second on a commodity serverAntonios Katsarakis
This slide deck presents DLHT, a concurrent in-memory hashtable. Despite efforts to optimize hashtables, that go as far as sacrificing core functionality, state-of-the-art designs still incur multiple memory accesses per request and block request processing in three cases. First, most hashtables block while waiting for data to be retrieved from memory. Second, open-addressing designs, which represent the current state-of-the-art, either cannot free index slots on deletes or must block all requests to do so. Third, index resizes block every request until all objects are copied to the new index. Defying folklore wisdom, DLHT forgoes open-addressing and adopts a fully-featured and memory-aware closed-addressing design based on bounded cache-line-chaining. This design offers lock-free index operations and deletes that free slots instantly, (2) completes most requests with a single memory access, (3) utilizes software prefetching to hide memory latencies, and (4) employs a novel non-blocking and parallel resizing. In a commodity server and a memory-resident workload, DLHT surpasses 1.6B requests per second and provides 3.5x (12x) the throughput of the state-of-the-art closed-addressing (open-addressing) resizable hashtable on Gets (Deletes).
How to Interpret Trends in the Kalyan Rajdhani Mix Chart.pdfChart Kalyan
A Mix Chart displays historical data of numbers in a graphical or tabular form. The Kalyan Rajdhani Mix Chart specifically shows the results of a sequence of numbers over different periods.
zkStudyClub - LatticeFold: A Lattice-based Folding Scheme and its Application...Alex Pruden
Folding is a recent technique for building efficient recursive SNARKs. Several elegant folding protocols have been proposed, such as Nova, Supernova, Hypernova, Protostar, and others. However, all of them rely on an additively homomorphic commitment scheme based on discrete log, and are therefore not post-quantum secure. In this work we present LatticeFold, the first lattice-based folding protocol based on the Module SIS problem. This folding protocol naturally leads to an efficient recursive lattice-based SNARK and an efficient PCD scheme. LatticeFold supports folding low-degree relations, such as R1CS, as well as high-degree relations, such as CCS. The key challenge is to construct a secure folding protocol that works with the Ajtai commitment scheme. The difficulty, is ensuring that extracted witnesses are low norm through many rounds of folding. We present a novel technique using the sumcheck protocol to ensure that extracted witnesses are always low norm no matter how many rounds of folding are used. Our evaluation of the final proof system suggests that it is as performant as Hypernova, while providing post-quantum security.
Paper Link: https://eprint.iacr.org/2024/257
inQuba Webinar Mastering Customer Journey Management with Dr Graham HillLizaNolte
HERE IS YOUR WEBINAR CONTENT! 'Mastering Customer Journey Management with Dr. Graham Hill'. We hope you find the webinar recording both insightful and enjoyable.
In this webinar, we explored essential aspects of Customer Journey Management and personalization. Here’s a summary of the key insights and topics discussed:
Key Takeaways:
Understanding the Customer Journey: Dr. Hill emphasized the importance of mapping and understanding the complete customer journey to identify touchpoints and opportunities for improvement.
Personalization Strategies: We discussed how to leverage data and insights to create personalized experiences that resonate with customers.
Technology Integration: Insights were shared on how inQuba’s advanced technology can streamline customer interactions and drive operational efficiency.
AppSec PNW: Android and iOS Application Security with MobSFAjin Abraham
Mobile Security Framework - MobSF is a free and open source automated mobile application security testing environment designed to help security engineers, researchers, developers, and penetration testers to identify security vulnerabilities, malicious behaviours and privacy concerns in mobile applications using static and dynamic analysis. It supports all the popular mobile application binaries and source code formats built for Android and iOS devices. In addition to automated security assessment, it also offers an interactive testing environment to build and execute scenario based test/fuzz cases against the application.
This talk covers:
Using MobSF for static analysis of mobile applications.
Interactive dynamic security assessment of Android and iOS applications.
Solving Mobile app CTF challenges.
Reverse engineering and runtime analysis of Mobile malware.
How to shift left and integrate MobSF/mobsfscan SAST and DAST in your build pipeline.
Northern Engraving | Nameplate Manufacturing Process - 2024Northern Engraving
Manufacturing custom quality metal nameplates and badges involves several standard operations. Processes include sheet prep, lithography, screening, coating, punch press and inspection. All decoration is completed in the flat sheet with adhesive and tooling operations following. The possibilities for creating unique durable nameplates are endless. How will you create your brand identity? We can help!
High performance Serverless Java on AWS- GoTo Amsterdam 2024Vadym Kazulkin
Java is for many years one of the most popular programming languages, but it used to have hard times in the Serverless community. Java is known for its high cold start times and high memory footprint, comparing to other programming languages like Node.js and Python. In this talk I'll look at the general best practices and techniques we can use to decrease memory consumption, cold start times for Java Serverless development on AWS including GraalVM (Native Image) and AWS own offering SnapStart based on Firecracker microVM snapshot and restore and CRaC (Coordinated Restore at Checkpoint) runtime hooks. I'll also provide a lot of benchmarking on Lambda functions trying out various deployment package sizes, Lambda memory settings, Java compilation options and HTTP (a)synchronous clients and measure their impact on cold and warm start times.
"Scaling RAG Applications to serve millions of users", Kevin GoedeckeFwdays
How we managed to grow and scale a RAG application from zero to thousands of users in 7 months. Lessons from technical challenges around managing high load for LLMs, RAGs and Vector databases.
Skybuffer SAM4U tool for SAP license adoptionTatiana Kojar
Manage and optimize your license adoption and consumption with SAM4U, an SAP free customer software asset management tool.
SAM4U, an SAP complimentary software asset management tool for customers, delivers a detailed and well-structured overview of license inventory and usage with a user-friendly interface. We offer a hosted, cost-effective, and performance-optimized SAM4U setup in the Skybuffer Cloud environment. You retain ownership of the system and data, while we manage the ABAP 7.58 infrastructure, ensuring fixed Total Cost of Ownership (TCO) and exceptional services through the SAP Fiori interface.
1. PRESS EMBARGO : 8.00am (6.00am GMT), September 18, 2012
September 18, 2012
New Passenger Car Registrations
European Union
E U i
Units New Passenger Car Registrations in the EU ‐ Last 12 months
1,700,000
‐7.0%
1,500,000
1,300,000 +0.7% ‐2.8%
-
‐3.5% ‐6.9%
1,100,000 ‐1.9% ‐1.8% ‐7.1%
‐6.4% ‐7.8%
‐9.7%
900,000
+8.0% ‐8.9%
700,000
500,000
July Aug Sept Oct Nov Dec Jan Feb Mar April May June July Aug
'10/'11 '10/'11 '10/'11 '10/'11 '10/'11 '10/'11 '11/'12 '11/'12 '11/'12 '11/'12 '11/'12 '11/'12 '11/'12 '11/'12
Series1 Series2
Not adjusted for working days
PASSENGER CAR registrations: -7.1% over eight months; -8.9% in August
After declining by 7.8% in July ne passenger car registrations were down by 8.9% in August Eight months
b 7 8% July, new ere do n b 8 9% August.
into the year, the downturn reached 7.1% as the EU* registered 8,268,642 new cars.
July results were negative across countries, except in the UK where the market expanded by 9.3%, totaling
143,884 new registrations. Elsewhere, the downturn ranged from -5.0% in Germany to -0.7% in France, -17.2% in
Spain and -21.0% in Italy. A total of 935,368 new registrations was recorded in the EU*, or 7.8% less than in the
same month a year earlier.
In August, EU* markets performed diversely. Germany saw its demand contract by 4.7%, while France (-11.4%)
and Italy (-20.2%) faced double-digit downturns. The Spanish (+3.4%) expanded and the British remained stable.
From January to August, the UK was the only market to post growth (+3.3%), while Germany slipped by 0.6%
and Spain (-8.5%), France (-13.4%) and Italy (-19.9%) recorded negative figures.
* EU27, data for Malta unavailable
Page 1 of 9
2. P r e s s R e l e a s e
Association des PRESS EMBARGO FOR ALL DATA :
Constructeurs 8.00 A.M.(6.00 A.M GMT), September 18, 2012
Européens
d'Automobiles
PROVISIONAL
Av. des Nerviens 85 NEW PASSENGER CAR REGISTRATIONS BY MARKET
B-1040 Bruxelles EUROPEAN UNION*
Tel (32 2) 732 55 50
Fax (32 2) 738 73 10
(32 2) 738 73 11
18/9/12
August August % Chg Jan - Aug Jan - Aug % Chg
'12 '11 12/11 '12 '11 12/11
AUSTRIA 24,570 25,884 -5.1 239,796 242,784 -1.2
BELGIUM 31,256 37,788 -17.3 353,073 399,119 -11.5
BULGARIA 1,519 1,644 -7.6 12,905 12,636 +2.1
CYPRUS 743 946 -21.5 8,190 10,023 -18.3
CZECH REPUBLIC 13,193 14,105 -6.5 118,584 114,507 +3.6
DENMARK 13,564 12,507 +8.5 114,565 113,381 +1.0
ESTONIA 1,423 1,312 +8.5 11,872 9,988 +18.9
FINLAND 7,535 10,024 -24.8 80,918 89,998 -10.1
FRANCE 96,067 108,462 -11.4 1,293,973 1,493,745 -13.4
GERMANY 226,455 237,561 -4.7 2,108,716 2,121,047 -0.6
GREECE 3,886 7,297 -46.7 42,072 72,513 -42.0
HUNGARY 3,539 3,428 +3.2 35,799 30,315 +18.1
IRELAND 3,098 3,238 -4.3 74,158 84,396 -12.1
ITALY 56,447 70,764 -20.2 981,030 1,224,096 -19.9
LATVIA 894 856 +4.4 7,251 6,851 +5.8
LITHUANIA 957 1,064 -10.1 8,210 8,759 -6.3
LUXEMBURG 2,899 3,018 3.9
-3.9 35,750 36,143 1.1
-1.1
NETHERLANDS 33,211 39,062 -15.0 396,101 409,500 -3.3
POLAND 18,088 19,597 -7.7 188,178 181,408 +3.7
PORTUGAL 5,443 8,131 -33.1 68,103 114,259 -40.4
ROMANIA 5,044 8,747 -42.3 44,392 49,006 -9.4
SLOVAKIA 5,947 5,190 +14.6 46,515 44,956 +3.5
SLOVENIA 3,072 4,170 -26.3 35,504 41,855 -15.2
SPAIN 48,820 47,223 +3.4 520,216 568,349 -8.5
SWEDEN 21,065 24,368 -13.6 181,774 201,031 -9.6
UNITED KINGDOM 59,433 59,346 +0.1 1,260,997 1,220,618 +3.3
EUROPEAN UNION (EU27)* 688,168 755,732 -8.9 8,268,642 8,901,283 -7.1
EU15 633,749 694,673 -8.8 7,751,242 8,390,979 -7.6
EU11* 54,419 61,059 -10.9 517,400 510,304 +1.4
ICELAND 473 299 +58.2 5,901 3,799 +55.3
NORWAY 11,790 11,464 +2.8 93,065 91,158 +2.1
SWITZERLAND 22,052 21,963 +0.4 224,360 206,259 +8.8
EFTA 34,315 33,726 +1.7 323,326 301,216 +7.3
EU27*+EFTA 722,483 789,458 -8.5 8,591,968 9,202,499 -6.6
EU15+EFTA 668,064 728,399 -8.3 8,074,568 8,692,195 -7.1
(*) data for Malta currently not available.
For further information, please contact: Ms. Quynh-Nhu Huynh - Director Economics & Statistics - E-mail: qh@acea.be - Tel. (32) 2 738 73 55
New Passenger Car Registrations in August
Units Results in the EU 2003 ‐ 2012
Percentage
1,000,000 +10.0
+8.4 +8.0
900,000 +3.5 +3.6 +5.0
+2.2
+0.0
800,000 ‐1.6
‐5.0
700,000 ‐8.9 ‐10.0
‐13.1
600,000 ‐15.0
‐15.6
500,000 ‐20.0
Aug/03 Aug/04 Aug/05 Aug/06 Aug/07 Aug/08 Aug/09 Aug/10 Aug/11 Aug/12
New Passenger Car Registrations % change year‐on‐year
Next press release: Tuesday, October 16, 2012
This information is available on the ACEA website: http://www.acea.be Page 2 of 9
3. P r e s s R e l e a s e
PROVISIONAL
NEW PASSENGER CAR REGISTRATIONS BY MANUFACTURER
EUROPEAN UNION (EU)*
18/9/12
August January - August
%Share Units Units % Chg %Share Units Units % Chg
'12 '11 '12 '11 12/11 '12 '11 '12 '11 12/11
ALL BRANDS** 688,168 755,732 -8.9 8,268,642 8,901,283 -7.1
VW Group 28.2 25.3 194,063 191,530 +1.3 24.8 23.1 2,052,495 2,054,843 -0.1
VOLKSWAGEN 14.5 13.6 99,661 102,841 -3.1 12.9 12.3 1,065,790 1,092,252 -2.4
AUDI 6.4 5.5 44,271 41,526 +6.6 5.6 4.9 462,834 440,048 +5.2
SEAT 2.6 2.4 17,892 18,271 -2.1 2.1 2.3 172,890 206,432 -16.2
SKODA 4.3 3.8 29,890 28,790 +3.8 3.8 3.5 317,332 314,783 +0.8
Others (1) 0.3 0.0 2,349 102 +2202.9 0.4 0.0 33,649 1,328 +2433.8
PSA Group 11.4 11.9 78,512 90,233 -13.0 12.1 13.0 1,001,100 1,157,379 -13.5
PEUGEOT 6.5 6.4 44,526 48,617 -8.4 6.5 7.1 538,184 629,943 -14.6
CITROEN 4.9 5.5 33,986 41,616 -18.3 5.6 5.9 462,916 527,436 -12.2
RENAULT Group 8.8 9.2 60,438 69,363 -12.9 8.6 9.6 713,682 852,231 -16.3
RENAULT 6.2 7.1 42,346 53,765 -21.2 6.7 7.8 553,741 690,240 -19.8
DACIA 2.6 2.1 18,092 15,598 +16.0 1.9 1.8 159,941 161,991 -1.3
GM Group 7.6 8.4 52,135 63,453 -17.8 8.3 8.7 685,731 778,796 -11.9
OPEL/VAUXHALL 6.2 6.9 42,387 52,239 -18.9 6.8 7.4 560,364 662,059 -15.4
CHEVROLET 1.4 1.5 9,738 11,183 -12.9 1.5 1.3 125,153 116,407 +7.5
GM (US) 0.0 0.0 10 31 -67.7 0.0 0.0 214 330 -35.2
FORD 6.0 7.7 41,536 58,403 -28.9 7.6 8.0 625,171 712,983 -12.3
FIAT Group 5.3 5.9 36,422 44,541 -18.2 6.6 7.4 543,309 655,440 -17.1
FIAT 4.0 4.3 27,231 32,303 -15.7 4.8 5.4 394,329 476,429 -17.2
LANCIA/CHRYSLER 0.5 0.6 3,634 4,884 -25.6 0.8 0.8 66,125 69,047 -4.2
ALFA ROMEO 0.6 0.7 3,841 5,649 -32.0 0.8 1.0 62,903 91,453 -31.2
JEEP 0.2 0.2 1,497 1,469 +1.9 0.2 0.2 17,175 13,788 +24.6
Others (2) 0.0 0.0 219 236 -7.2 0.0 0.1 2,777 4,723 -41.2
BMW Group 5.9 6.2 40,634 47,000 -13.5 6.0 5.8 498,298 514,368 -3.1
BMW 4.9 5.1 33,912 38,743 -12.5 4.8 4.6 399,621 411,820 -3.0
MINI 1.0 1.1 6,722 8,257 -18.6 1.2 1.2 98,677 102,548 -3.8
DAIMLER 5.5 5.1 37,711 38,214 -1.3 5.1 4.9 422,439 434,049 -2.7
MERCEDES 5.0 4.6 34,176 34,416 -0.7 4.5 4.3 374,654 380,017 -1.4
SMART 0.5 0.5 3,535 3,798 -6.9 0.6 0.6 47,785 54,032 -11.6
TOYOTA Group 4.3 4.2 29,550 31,454 -6.1 4.2 3.9 345,203 348,677 -1.0
TOYOTA 4.1 3.9 28,301 29,747 -4.9 4.0 3.7 327,476 332,915 -1.6
LEXUS 0.2 0.2 1,249 1,707 -26.8 0.2 0.2 17,727 15,762 +12.5
NISSAN 3.2 3.0 21,748 22,920 -5.1 3.4 3.3 285,249 298,121 -4.3
HYUNDAI 3.7 3.5 25,317 26,085 -2.9 3.4 2.8 278,757 253,244 +10.1
KIA 3.0 2.4 20,308 18,077 +12.3 2.6 2.0 216,985 176,202 +23.1
VOLVO CAR CORP. 1.3 1.4 9,091 10,756 -15.5 1.7 1.8 138,660 156,898 -11.6
SUZUKI 1.4 1.3 9,421 9,858 -4.4 1.2 1.3 100,112 112,265 -10.8
HONDA 1.1 0.9 7,905 6,596 +19.8 1.1 1.0 87,080 92,406 -5.8
MAZDA 1.0 1.0 6,749 7,537 -10.5 1.0 1.0 80,498 90,309 -10.9
JAGUAR LAND ROVER 0.6 0.3 3,849 2,601 +48.0 0.9 0.6 76,683 56,611 +35.5
LAND ROVER 0.5 0.2 3,256 1,883 +73.0 0.8 0.5 62,272 43,065 +44.6
JAGUAR 0.1 0.1 593 718 -17.4 0.2 0.2 14,411 13,546 +6.4
MITSUBISHI 0.6 0.9 4,377 6,441 -32.0 0.6 0.8 48,166 72,283 -33.4
OTHER** 1.2 1.4 8,402 10,670 -21.3 0.8 0.9 69,024 84,177 -18.0
(1) VW Group: VW 'other' include Bentley, Bugatti, Lamborghini, and since Aug '12 Porsche For further information, please contact:
(2) FIAT Group: FIAT 'other' include Dodge, Ferrari, Maserati Ms. Quynh-Nhu Huynh - Director Economics & Statistics
(*) data for Malta n.a. E-mail: qh@acea.be - Tel. (32) 2 738 73 55
(**) ACEA estimates
Page 3 of 9